
Reports: the reports cockpit and its lenses
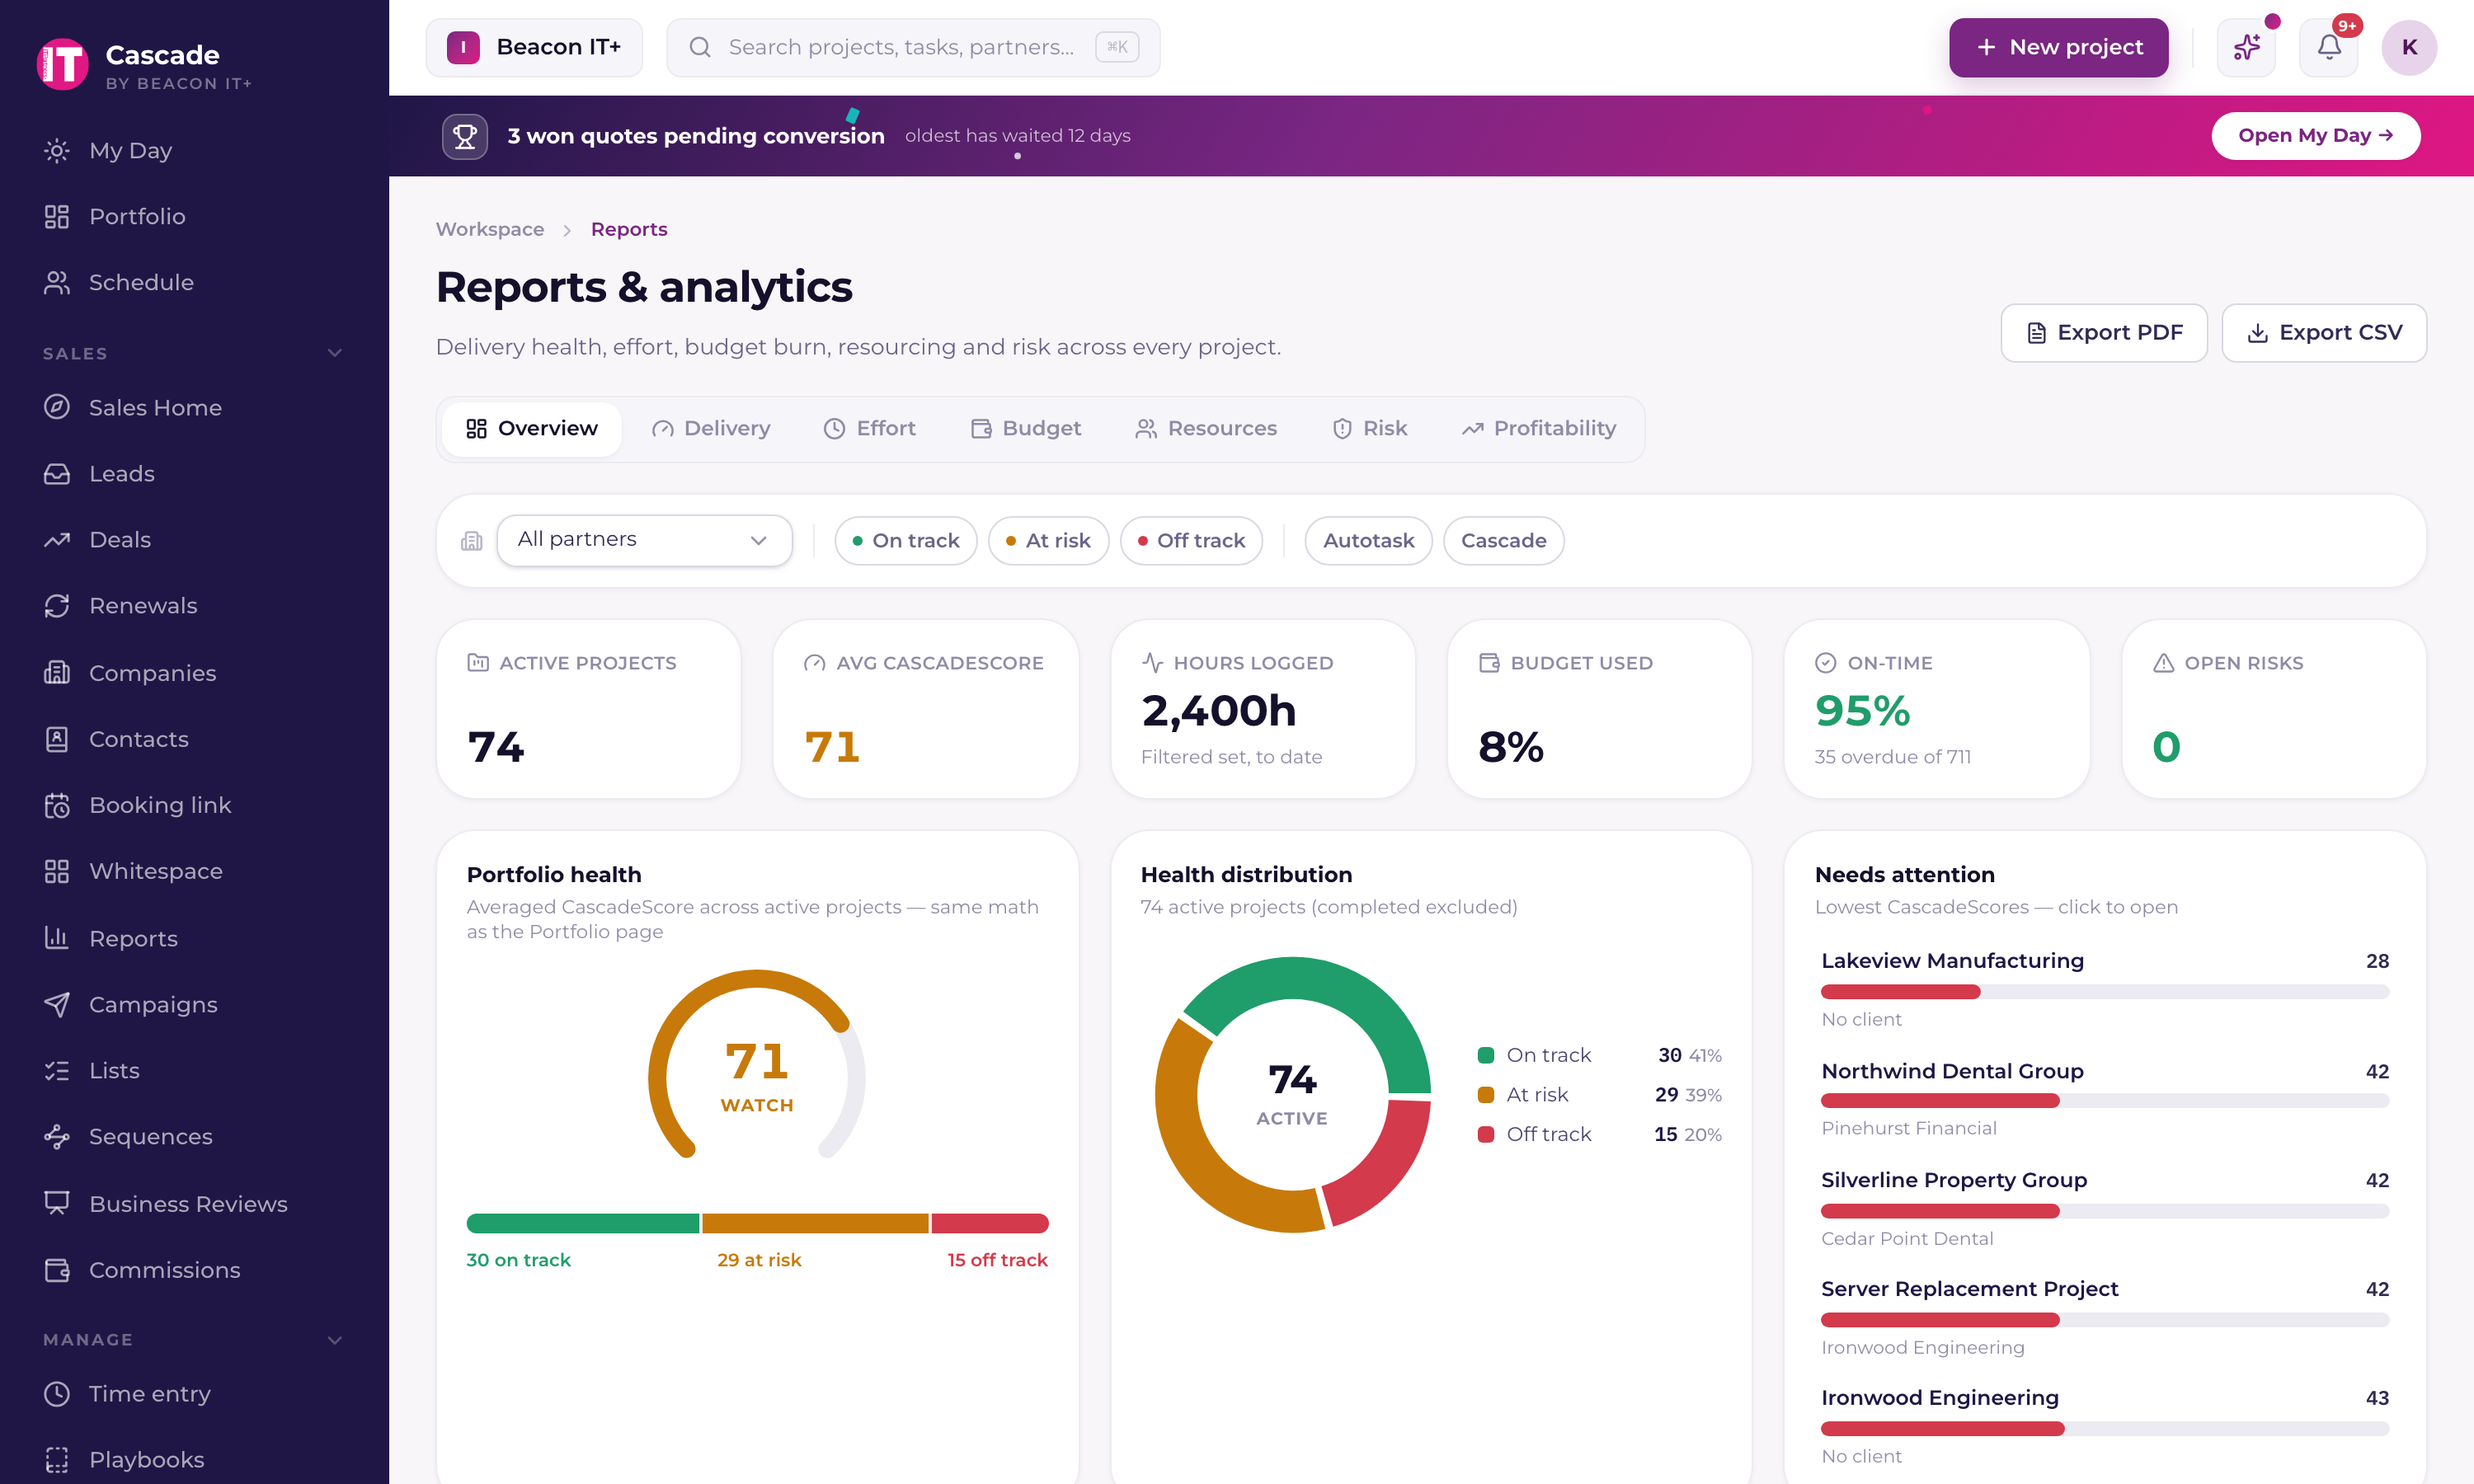
Reports turns your portfolio into a small set of focused lenses instead of one giant spreadsheet — pick the question you're answering, and the view narrows to just that.
It opens on Overview. The dashboards you build yourself used to be the first tab here; they now have their own page in the left navigation, directly under Companies, and a link you saved to the old tab takes you there. See "Build your own dashboard gauges with AI." The fixed lenses are unchanged, and a link you saved to one still lands where it always did.
The lenses
| Lens | Who sees it |
|---|---|
| Overview (the default) | Everyone with report access |
| Delivery | Everyone with report access |
| Effort | Project Managers and above |
| Budget | Everyone with report access |
| Resources | Project Managers and above |
| Risk | Everyone with report access |
| Profitability | Tenant Admins only |
Which calendar these numbers are counted on
Every window on this page is cut in your workspace's time zone: today, this week, this month, this quarter. There is one zone for the whole workspace rather than one per person, so a report means the same thing to everyone who opens it. A tenant admin sets it in Settings, under Integrations, in the Workspace basics section, and it starts on the zone Current already used for notification timing and the lead response clock, so there is usually nothing to set.
The printed and PDF header names that calendar, on its own line under the date the report was generated. A report you hand to a partner therefore says which midnights its windows were cut on, which is the difference between a number they can check and a number they can only take on trust.
Two things moved on 26 July 2026 when this shipped, both of them at the edges of a window. The date range every lens on this page reads from now starts and ends at your midnights instead of the midnights of whoever opened the page, so anything sitting right at the edge of that window can shift, and hours logged late in the evening are the usual case. Effort and Resources, the two lenses whose range you can change, are where you would notice it. And on the sales side, the Pipeline, Forecast, MRR movement and AE scorecard lenses used to cut their months and quarters at UTC midnight, so on any workspace outside UTC a deal that closed late on the last evening of a month could sit in the wrong month. It now sits in yours.
What counts as worked hours in these lenses
Two kinds of time entry are real rows on the Time page that are not delivered work, and since 26 July 2026 neither one counts here: time a manager rejected, and time your PSA voided or deleted during pre-invoice review, which nobody was ever billed for. Effort, Resources, Budget and Profitability all read lower than they did before that date, and the change is a correction rather than lost work.
- +Effort and Resources show fewer hours per person and per project.
- +Budget shows less burn, so the burn-rate trend flattens slightly and the count of projects over budget can fall. A project that was only over budget because of voided or rejected hours stops being named, which is the point.
- +Profitability moves on both sides, and not always the same way. On a project with a billable rate, revenue and cost both come from hours, so they fall together and the margin percentage shifts only a little. On a project with no billable rate, revenue is the budget amount and does not move at all, so dropping the voided and rejected cost makes that project's margin read higher than it did. The revenue basis is shown on the row, so you can tell which kind you are looking at.
- +Export CSV moves with the lenses, since its actual-hours and budget-used columns are the same numbers. A spreadsheet you exported before 26 July will not match one you export now.
Exporting
- +Export PDF produces a branded, printable report — your workspace name, the active lens, any partner/client filter, and the date range are stamped on it.
- +Export CSV downloads a project rollup: project, partner, health, status, progress, sync mode, budgeted vs. actual hours, budget used, estimated vs. actual, open risks, and Current Score — one row per project.
Who can open Reports at all
Reports is a staff surface. Partners never see it — visiting from the portal shows a notice explaining that reports aren't part of the partner experience, not a stripped-down version of the page. See "What partners can see — and what they never can" for the full partner contract.