
MRR movement and churn: who left, who shrank, who grew
MRR movement & churn is the report to open when you want to know what happened to your recurring revenue in a period: what it was at the start, what it is now, which customers left, which shrank and which grew, and exactly what changed inside each one. Open Reports and pick it under Sales. It reads your agreements, the recurring services your PSA bills, so it answers what is billed, not what was sold.
Who can see it
Tenant admins, Finance and sales leaders see the whole book. An account executive sees their own book: the customers where they are an account manager, primary or co-owner, and the report says so under the figures. Nobody else sees it. A project manager or engineer with CRM access does not get it, and a Partner Viewer never does. The rule is checked in the database every time the report is read, including for a scheduled email, which is computed as the person it is sent to. A customer group is one customer, so an account executive who owns one site of a group sees the whole group, every site.
What counts as MRR
MRR is recurring revenue only, from the agreements mirrored from your PSA. Each service line is turned into a monthly figure using that line's own billing period, so an annual line counts a twelfth of its price each month. Project and one-time revenue never enter this report.
A customer's MRR on a day is read from the daily record Current keeps. For days before Current started recording, it is rebuilt from agreement start and end dates at today's prices. Those days are labelled rebuilt and drawn faded, and the notes at the foot of the report give the date the daily record starts. When one side of a comparison is rebuilt and the other was recorded, the recorded side is priced the rebuilt way too for that comparison, so the two compare like with like, and the result is marked rebuilt. Today is always priced live.
How each customer is counted
The unit is the customer, not the PSA company. A customer group (several sites kept as separate companies in your PSA) counts as one customer, and a company in no group is its own customer. Each customer's MRR is compared at two edges: the day before the period starts, and the period's last day (today for a period that runs to today). The first row that fits decides the class:
| Class | When | Amount |
|---|---|---|
| Acquired | No MRR at the start, some at the end, and the company carries your acquisition label | MRR at the end |
| New | No MRR at the start, some at the end, and it never paid for a recurring service before the period | MRR at the end |
| Reactivation | No MRR at the start, some at the end, and it paid for a recurring service before the period (an agreement with a line above zero, not just an agreement on file) | MRR at the end |
| Churn | MRR at the start, none at the end | MRR at the start |
| Expansion | More MRR at the end than at the start | End minus start |
| Contraction | Less MRR at the end than at the start, but still some | Start minus end |
Renewals and agreement rewrites need nothing from you. A renewal at the same price nets to zero, and a renewal at a new price shows only the difference. There is no reclassify button and no small-change threshold: every change counts at its real size.
A site that leaves a customer group whose other sites still pay is Contraction on the group, not Churn, and the site is listed under the group as "Site left".
Retention and the rates
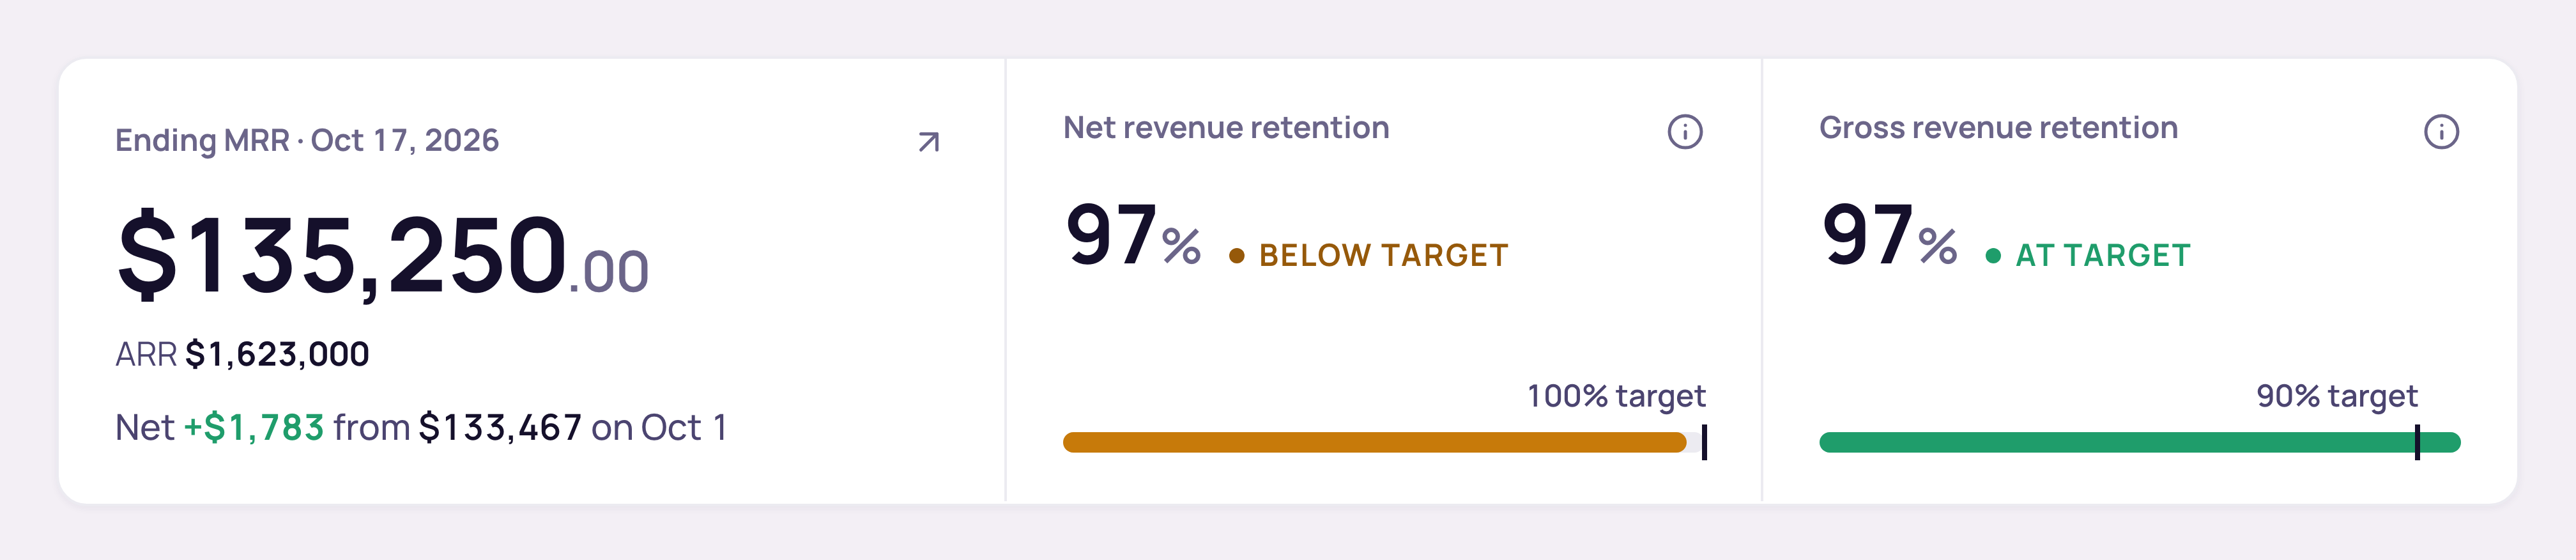
- +Net revenue retention (NRR): the starting book, minus contraction and churn, plus expansion, divided by the starting book. New customers are left out. Above 100% means the customers you started with grew.
- +Gross revenue retention (GRR): the starting book minus contraction and churn, divided by the starting book. It never goes above 100%.
- +Logo churn rate: customers who churned, divided by customers who had MRR at the start.
- +Gross revenue churn: contraction plus churn, divided by the starting book.
- +Quick ratio: new, expansion, reactivation and acquired MRR, divided by contraction and churn. With no losses in the period it reads "No losses this period" instead of a number.
- +Net new MRR, customers paying and average MRR per customer sit beside them, each compared with the period before.
Over a window of 28 days or more, the monthly rates are shown as the compounded monthly equivalent, and the report says so. The months are counted from the start of the window to its last day: calendar months when the window starts on the first of a month, quarter or year (the month you are in counts as one), otherwise the days divided by 30.4375. Under 28 days there is no monthly equivalent: logo churn and gross revenue churn are the rate for the period itself, marked in this period, and the average customer lifetime, the compounded monthly growth rate and the annual figures show a dash, marked Needs a period of at least 28 days. A figure that is rebuilt from agreement dates, such as NRR and GRR over the last 12 months when the daily record is younger than that, carries a Rebuilt mark and no benchmark. The investor view adds NRR and GRR over the last 12 months, the compounded monthly growth rate over the window, the largest customer's and the top 10 customers' share of ending MRR, the average customer lifetime (1 divided by monthly logo churn), and the cohort grid: each row is the customers that started in a quarter, and each cell is their MRR that quarter as a share of their first quarter, so it can pass 100%.
What changed inside a customer
Who left, Who shrank and Who grew list each customer with the amount and the change in words. A customer that left says the month it stopped; one that shrank says the month it fell. A list shows 100 customers at a time, and Show 100 more adds the next 100; a scheduled PDF prints the first 40 of each list and points to the CSV for the rest. Open a row to see its service lines. A line is a service on a customer's agreements, matched by name, so the same service on a renewed agreement is the same line.
- +Added or Removed: a service with no MRR at the start and some at the end, or the other way round. Added on an existing customer is a cross-sell.
- +Seats: more or fewer seats at the old unit price, for example "−8 seats Managed Workstation".
- +Price: the change in unit price across the seats they have now, for example a price uplift of $3 a seat. Seats and price always add up exactly to the line's change.
- +Moved to a cheaper plan or Moved to a bigger plan: in one period the customer dropped at least one service and took at least one new one. The label sits on the customer, and the lines are still listed.
Price against seats, and growth by service
Price against seats adds the whole book's change into four tiles: the seat effect, the price effect, services added and services removed, with a line saying how many customers a price increase landed on. Use it to check whether a price increase actually landed. By service lists every recurring service across the book with its MRR at the start and end, the change, the change in units and how many customers hold it, growing first.
Where the movement sits
The same columns (starting book, new, expansion, contraction, churn, NRR, GRR) broken down three ways:
- +By account manager: the customer's primary owner on the period's last day. A group takes the owner of its site with the most MRR at the start of the period (at the end, for a group that is new), so a group never moves to the owner of a small site that stayed.
- +By how long they have been a customer: under 1 year, 1 to 3 years, 3 years or more, from the earliest recurring agreement's start date.
- +By size: under 1,000 a month, 1,000 to 4,999, and 5,000 or more, in your workspace currency.
Leaving soon and renewals at risk
Leaving soon looks forward, and it is never counted in the history above it. It lists agreements that will stop billing in the next 6 months with nothing to replace them yet, by month:
- +Cancelled: the agreement is already retired in your PSA and has an end date still to come. Current counts the loss on the day it was retired, so it already shows in the movement above (as churn, or as contraction when the client still pays for other services) and is listed here only so you can see the date billing stops; it is never added to the Leaving soon totals.
- +Ends with no renewal yet: the agreement is active, ends in the next 180 days, and no later agreement for the same company carries the same services.
Renewals at risk ranks agreements ending in the next 180 days, riskiest first, with the reasons in short words: the company's relationship risk score, unhappy tickets and billing complaints in the last 30 days, a negative CSAT result, and how long since the last business review. A signal that is not connected is left out, never counted as fine.
Why they left: churn reasons
Every Churn and Contraction row has a reason picker: Price, Service quality, Acquired or merged, Took IT in-house, Moved to a competitor, Business closed, Budget cut, Moved away, Consolidated vendors, or Other, with an optional note of up to 500 characters. One reason is kept per customer per month, and changing the reason keeps the note.
Press Suggest a reason and Current reads that customer's last 180 days (ticket subjects, ticket signals, notes, CSAT results and the lost reasons on their deals) and suggests one reason with a sentence saying why. Nothing is saved until a person presses Use this or picks a reason. No money figure is sent to the AI for a suggestion. An account executive can set reasons only on their own book.
Check these: what your PSA billed
Check these compares each customer's MRR at the last complete month with what your PSA billed as recurring for that month (from the billing items Current mirrors from your PSA, where your PSA provides them). A customer is listed when the two differ by more than 5% and at least 50 in your currency: "Check this: Current reads $X/mo from the agreements; your PSA billed $Y in <month>." Your PSA is presumed right, so start there. When no billing items are mirrored the section is left out with a note, never shown as $0 billed. A customer your PSA billed nothing for that month is listed only if your PSA billed them as recurring at some point in the 12 months before, so customers billed through a parent account or another company don't show up as false alarms.
Benchmarks
A figure carries a benchmark only where a published source about managed service providers gives one, with its source named in the notes. Today that is annual client churn (ScalePad's 2026 MSP Trends Report, a survey of more than 1,100 North American MSPs, where the median MSP reports 1 to 5% a year) and net revenue retention (RKCA's IT MSP Industry Insights, 2024, which puts a best-in-breed MSP above 95%). Figures with no credible published MSP number, such as GRR and the quick ratio, have no benchmark. Benchmarks never use other workspaces' data.
The summary, the board view and exports
A short written summary sits at the top. The numbers in it are computed by the report, and the AI only writes the sentences around them: a sentence with a figure the report did not compute is dropped.
Press Board view for the one-page version for a board or an investor: the summary, the top line, the bridge and the investor view, plus one line on who left. Export PDF in board view gives the one-page board PDF with the same numbers. Export CSV and email schedules work as they do for every report.
Bookings from deals
The deal-based view this report used to show (what the team closed as new business, expansion and churned renewals) is kept in one folded section at the bottom, Bookings from deals. Selling and billing happen at different times, so the two rarely match: a deal can close months before or after the agreement changes.